Welcome to episode two of the “Building on the Awesense Platform” series. This is a multi-part series, where we showcase the power of the Awesense Digital Energy Platform, the Awesense Data Engine, and the Awesense Open Energy Data Model. In this series we show you how these features can be used to rapidly build, test, and prototype applications and analytics using a variety of software tools and techniques. In this episode specifically, we discuss Low, and even No Code options.
Feeling a little lost? This series is meant to build not just applications, but also gradually demonstrate different techniques from least complex to the most complex. If you haven’t read the first article in this series, we suggest you start here.
TGI’s Philosophy- Sharing is Caring
In case you were wondering, TGI stands for True Grid Intelligence. It is the front-end portion of the Awesense Digital Energy Platform, not to be confused with our backend Awesense Data Engine.
Here at Awesense, we’re a family of data-heavy, technically-minded folk. But we are a big fan of Low and No code tools and applications.
This new trend is democratizing the ability for anyone with a non-technical background to derive maximum benefit and value from our platform and its synchronized data. And for any technical folk like us, this trend means that we can bring our platform to an even broader group of professionals for bringing their own ideas to life.
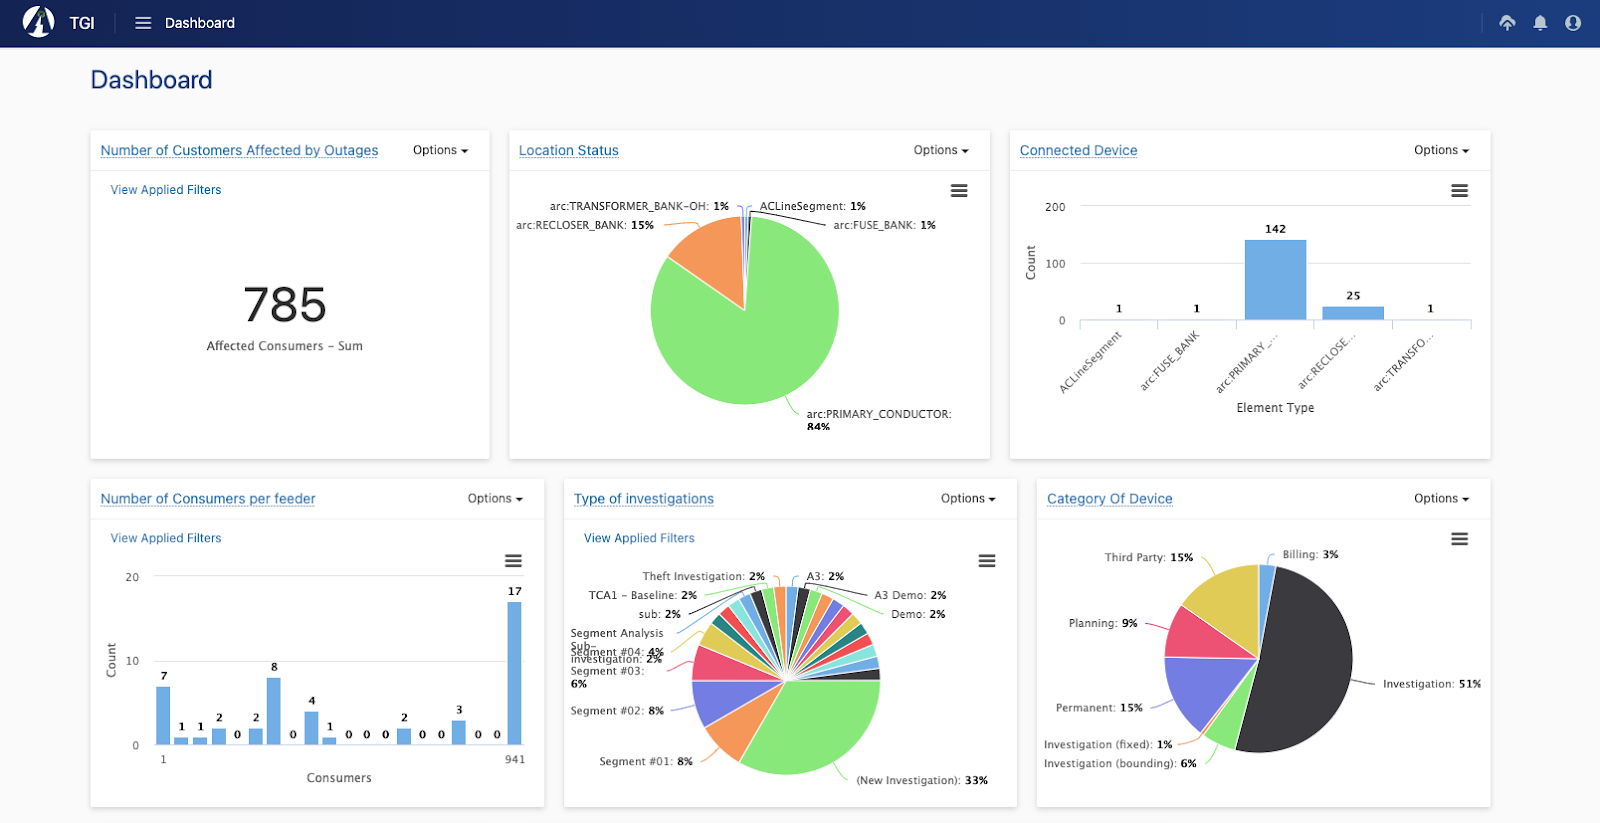
So what does that look like in practice? Low and No Code solutions mean a user interface that allows you to drag and drop, or even select from a dropdown menu. All without having to write a single line of code. With TGI, we understand the needs of our clients and bring TGI Flexible Charting into life. TGI Flexible Charting allows for Low and No Code development- that means no coding background is needed! That is part of the TGI philosophy, offering all of our users a simple, and easy-to-use platform as a way of building analytical content to drive better decision making. Look at some examples of the charts you can create quickly with TGI Flexible Charting:
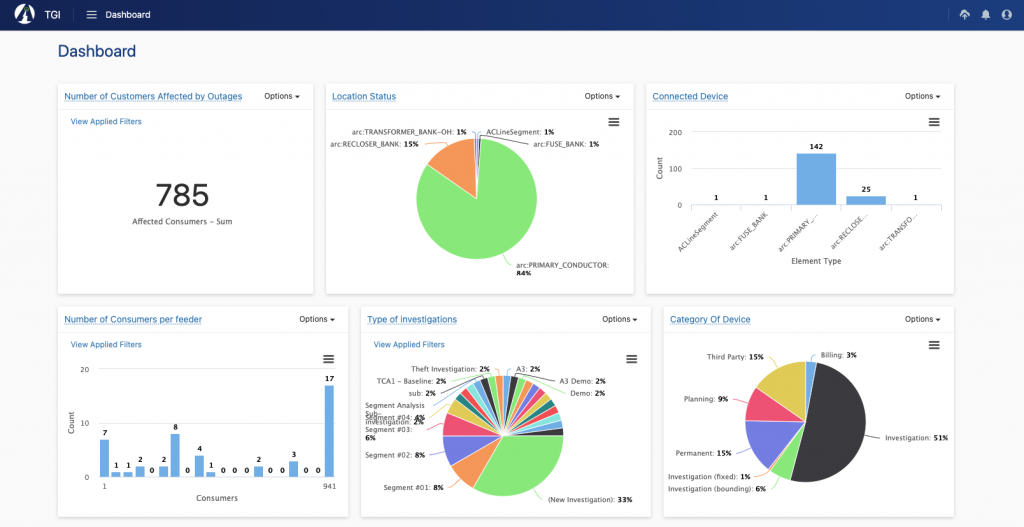
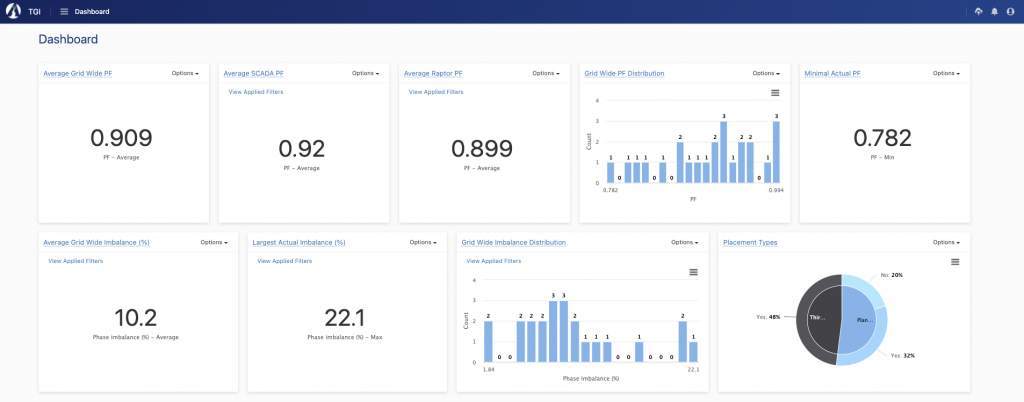
This is a view of the final dashboard created using TGI’s Flexible Charting Feature, all of which can be created without a single line of code.
TGI Flexible Charting
Now that you know our take on sharing and a positive user experience, we can understand TGI Flexible Charting a lot better.
What is it?
TGI Flexible Charting is simply the ability to build and create charts to display your data the way you want to see it. All without needing to know how to code. This means that you can analyze, interpret, and explore the different ways you understand how your system is behaving. All of this is done in real-time, and switching between views is a single click away.
The TGI solution gives our customers access to use out-of-the-box applications and analytics combined with the Awesense Digital Energy Platform to prepare for the future of energy, using data from smart meters, distributed energy resources (DERs), electric vehicles (EVs), and other data sources. That means that TGI’s Flexible Charting feature allows you to see all of this information, in the way that works best for you. With TGI Flexible Charting, you never have to worry about installing or managing the tools for Low and No code development, because it is native to the Awesense Digital Energy Platform. All of your data is already connected and available. And each tabular view throughout TGI can be utilized for the flexible charting of dashboards and reports, and any of the extensive out-of-the-box applications.
Can I share?
So what can you do with it besides see your data in the best way that helps you understand it? You can create custom reports based on your dashboards, and even share them with team members across your organization – you know we love sharing!
Who is this for?
We built the Awesense Digital Energy Platform so everyone can use data to their advantage. That means professionals who are interested in analytics but don’t have development or coding skills are no longer restricted. If anything, it is designed for professionals who would like to quickly answer questions and make data-driven decisions with speed and confidence. No more trading one for the other because the data did not make sense or the right tool for building the analytics is not available
TGI Flexible Charting In Action
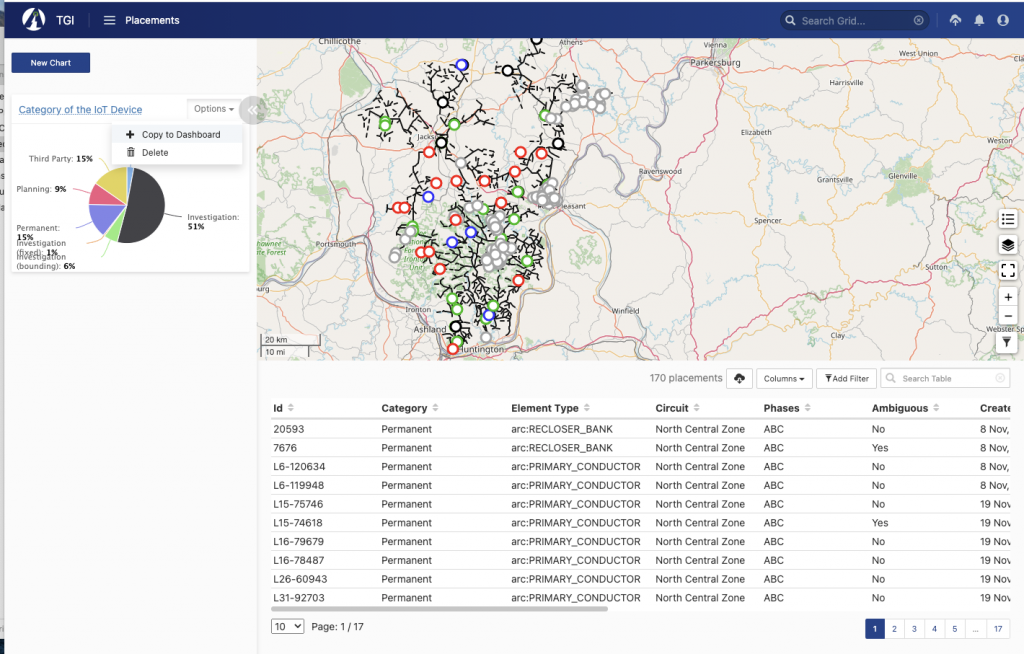
It’s easy to read about these features and get lost in the information. Below are some examples of TGI Flexible Charting, in action. Let’s take some general ideas and say that we want to show a subset of the IoT devices the platform is monitoring and what categories each of the devices fall into. We will use Awesense demo grid data for this example. We would do this on TGI’s Placement page within the platform:

Creating this chart is simple, we just need to click the “New Chart” button:
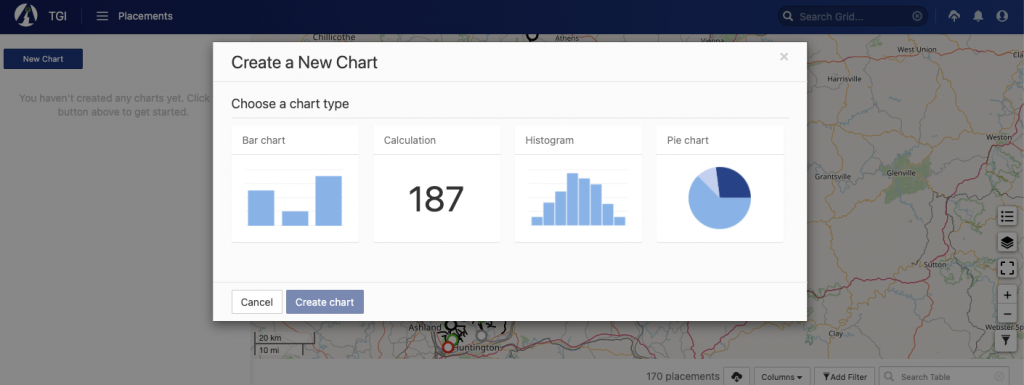
You can see there are four types of charts that can be created: Bar Charts, Calculations, Histograms, and Pie Charts. Let’s choose a Pie Chart. On the Pie Chart menu just choose what you want to see using drop-down menus.
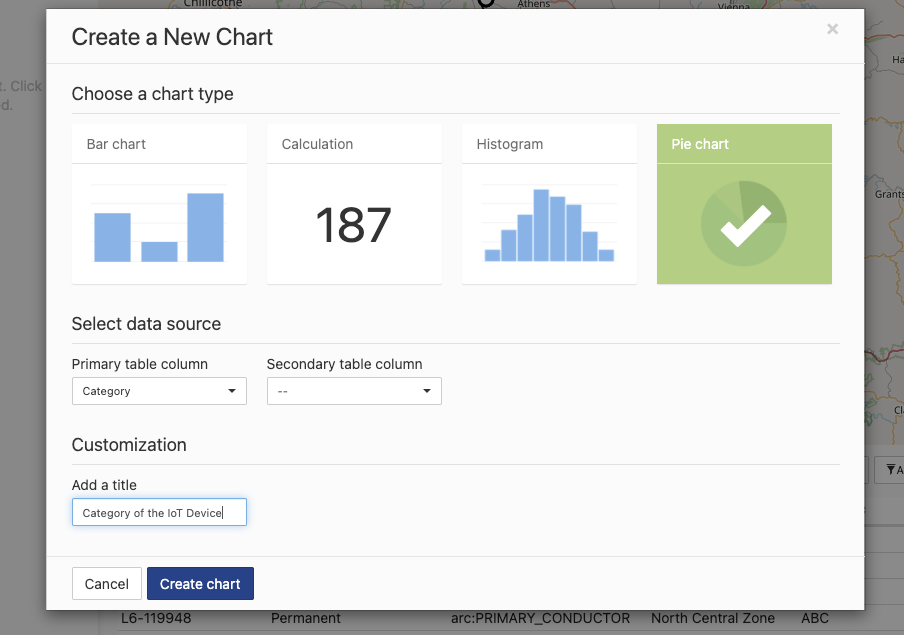
The pie chart is then easily created on the page, from where it can be sent to the dashboard and displayed as a dashboard widget.
This way, users can use Low and No code techniques for the creation of themed, live dashboards and reports which can be easily shared across the organization. As an example, here is a power quality monitoring dashboard that we built for one of our clients.
Other charts
In another example, users can look at all the active work orders in their service territory overlaid on a map.
Here, a user may want to see how many active work orders there are and create a calculation chart to display that. Next, the user may want to see which field technician each of these is assigned to and what the priority of each is. The user can toggle through interactively, choose to download the data in various formats and add the widgets to a dashboard.
Where to next?
In our next episode of this series, we will be discussing one of the most widely used analytics tools by organizations that work with us. Curious to know what that is? Well, stay tuned to find out!
We love connecting, and we would love for you to share our content! Follow along with this series and let us know what ideas YOU would like to see us write about. Whether it’s more content about Low and No Code capabilities or even a specific use case or tool you would like to know more about, let us know.
If you or your team are interested in building a custom application using the Awesense Platform, or you have an analytical tool we should demonstrate with our platform, feel free to reach out to us at tools@awesense.com.