Welcome to episode three of the “Building on the Awesense Platform” series. This is a multi-part series, where we showcase the power of the Awesense Digital Energy Platform, the Awesense Data Engine, and the Awesense Open Energy Data Model. In this series we show you how these features can be used to rapidly build, test, and prototype energy-focused applications and analytics using a variety of software tools and techniques. In this episode specifically, we discuss spreadsheets.
Feeling a little lost? To help you understand and navigate this article better, we suggest starting with some earlier content. This series is meant to build not just applications, but also gradually demonstrate different techniques from least complex to the most complex. If you haven’t read the first article in this series, we suggest you start here, and if you haven’t read article two yet, you can start here.
Everything You Need to Know About Spreadsheets
This is the part where we start to build on the complexity from last week – we will discuss spreadsheets. We can’t do that without a little introduction on what they are, why we use them, and what some popular tools are. We promise we’ll get to the good stuff right after this!
What are spreadsheets?
At its basics, spreadsheets are files that store data in a tabular format. They hold data from anywhere you like through manual or automated entries. They also allow you to properly categorize and analyze your data, all while keeping track of it in a single place.
Why do we love spreadsheets?
We love spreadsheets because they are used for a variety of projects! That versatility and utility they offer is exactly why we are introducing them in this edition of the series. Spreadsheets enable us to address multiple use cases. Some notable examples include record keeping, complex mathematical calculations and data modeling, reporting, data sharing, data visualization & dashboarding, and even data analytics.
Due to their ubiquity, there is not an industry today that doesn’t use spreadsheets as a part of their organization’s operations. Whether it’s finance, healthcare, or even energy, everyone uses spreadsheets!
CSVs Are Spreadsheets Too!
How could we ever forget about the popularity of the Comma Separated Value (CSV) file format? We can’t! Though most commonly used for data exchanges, a CSV is a file format that is easily readable through our eyes but can be opened natively in spreadsheet softwares like those mentioned above. This adds to the popularity of spreadsheets and the versatility of what they bring to the table. Needless to say, spreadsheets are a team player!
Common Spreadsheet Applications
Spreadsheets are so common these days that a number of organizations offer great spreadsheet applications. Common players in the spreadsheets market are tools like Microsoft Excel, LibreOffice Calc, Apple Numbers, and Google Drive Spreadsheets.
Our Favorite Spreadsheet- Microsoft Excel
The leading spreadsheet software is Microsoft Excel (Excel from here on). Yes, you read that correctly. The same Excel application you were using a decade or two ago when you were in school, is still the most prominent spreadsheet software to this date- talk about consistency!
Why Microsoft Excel Rules the Spreadsheet World
Excel has reigned as the spreadsheet king because of its significant footprint in the high-level data analytics world. Excel comes pre-installed on many computers. This has added to its popularity and ubiquity. More importantly, Excel has worked hard to democratize working with data. Requiring almost no knowledge to begin using the application, children around the world learn Excel from as young as six years old!
From a data analytics standpoint, Excel uses data visualizations & dashboarding, reporting, and a lot more, all without users knowing a single line of code. For those looking for the quickest data analysis out there, Excel is often the go-to. It’s an easy-to-use and incredibly powerful tool, all housed in that seemingly simple green “e” on your desktop.
Why is Excel our favorite spreadsheet?
Excel democratized data the way Awesense aims to democratize energy, can you see why we’re so fond of their spreadsheets? At Awesense, we’re passionate about bringing analytics and analytical capabilities to anyone and everyone, regardless of their data analytics skills and backgrounds, we believe Excel is helping people do the same.
So how do we use Excel in the Awesense Digital Energy Platform? Let’s take a look at some examples and see (this is that fun part)!
Analyzing a CSV File in the Awesense Platform
The Awesense Digital Energy Platform can produce CSV data, so let’s take a look at an example of a typical use case many utilities are dealing with. The following example will describe the process of filtering an Outage Data table in the platform’s user interface (UI), exporting that data to a CSV file, and then working with that data in Excel.
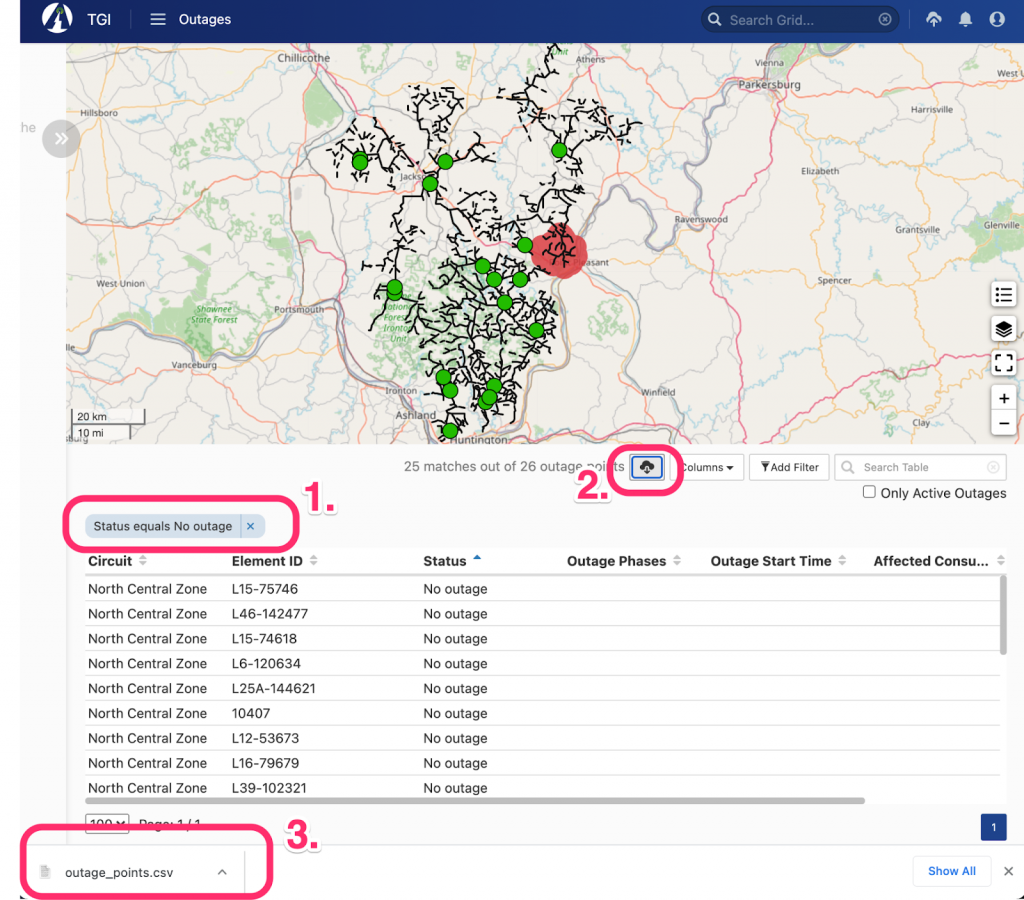
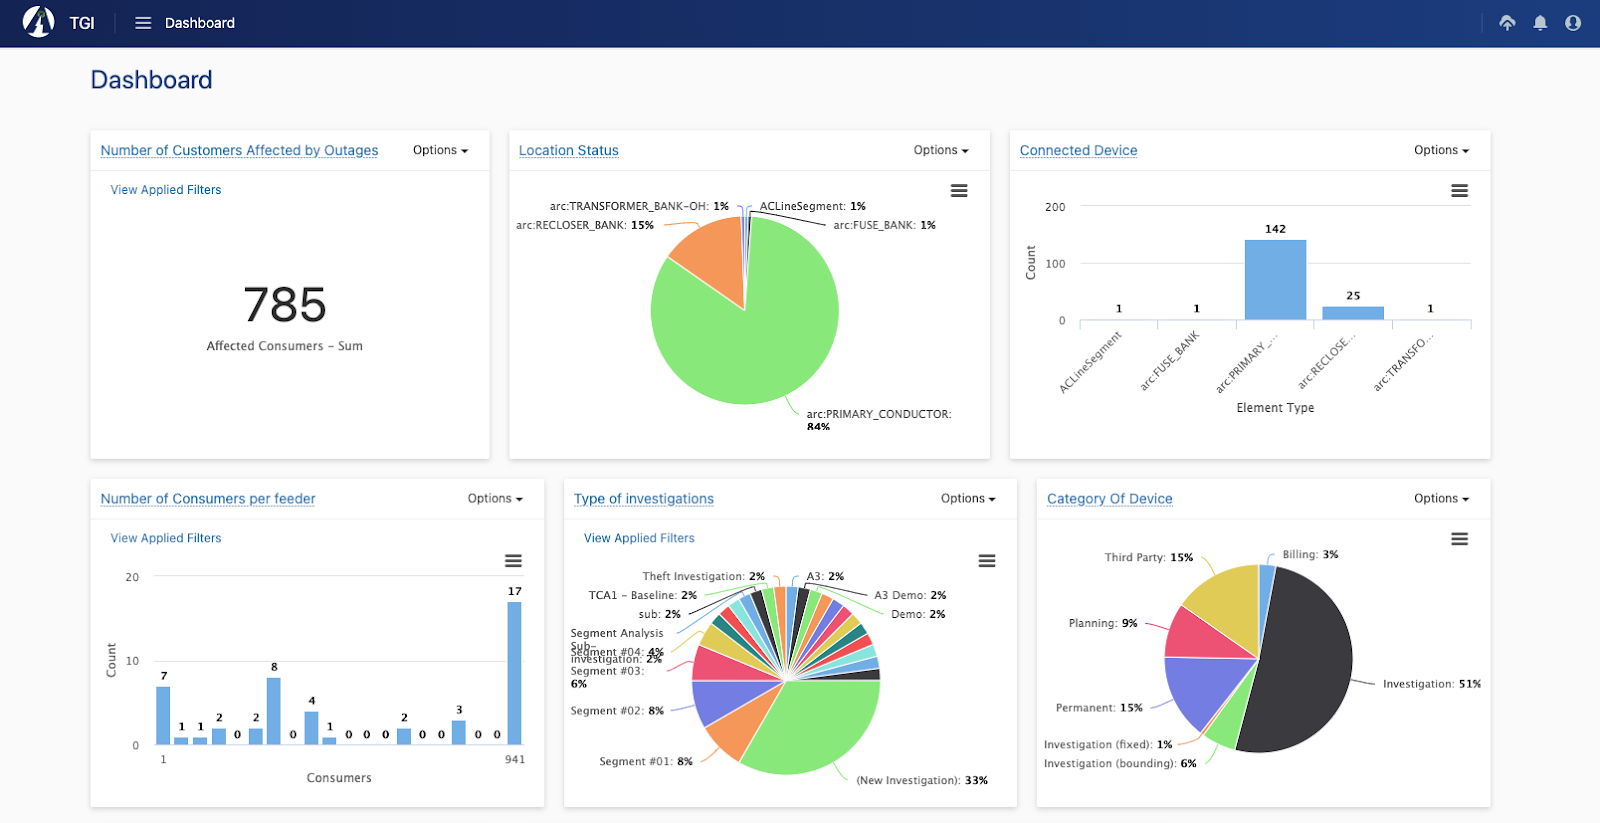
Each table throughout the Awesense platform is filtered and data is exported to a CSV file. The screenshot above shows the Awesense Platform’s Outage Page with all recorded outages. All of this is sample data; we live and breathe cybersecurity, so we can’t show you the real thing! In this example, the outage table was filtered to display past outage occurrences before being exported as a CSV file.
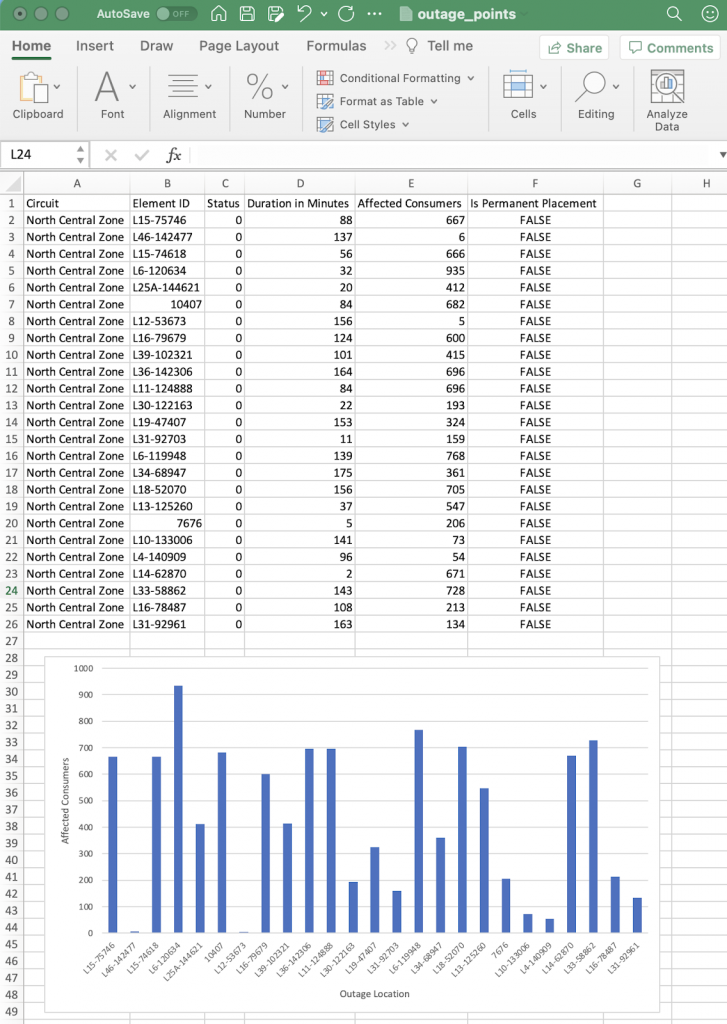
From there, we can simply open the CSV file in Excel because it is a native form of data- remember, CSVs are spreadsheets too! With that, we can now create a summary of this outage data, prepare a data report, or create a visualization for a PowerPoint presentation.
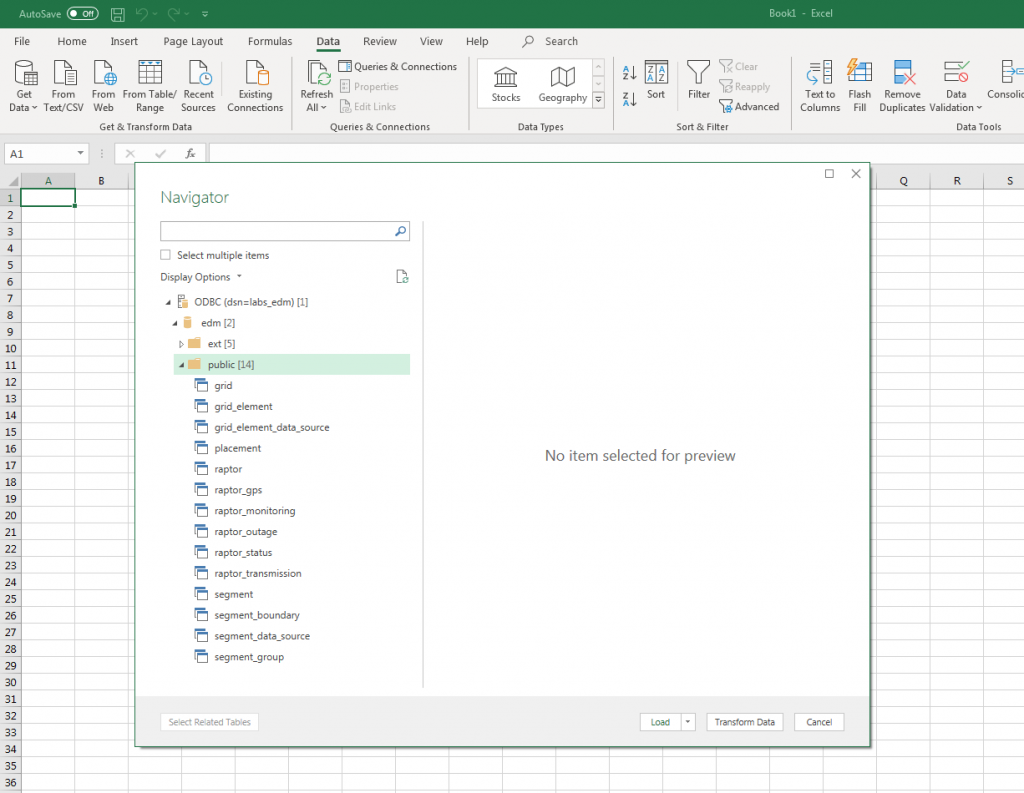
Was that example a bit too manual for you? If you need more convenience and automation, Excel has a toolset that can connect to the Awesense Open Energy Data Platform (OEDP). You will need a simple ODBC driver to proceed from here. After that, Awesense can provide each user with unique login credentials. These credentials can then be imputed into Excel’s UI for establishing the connection between the two.
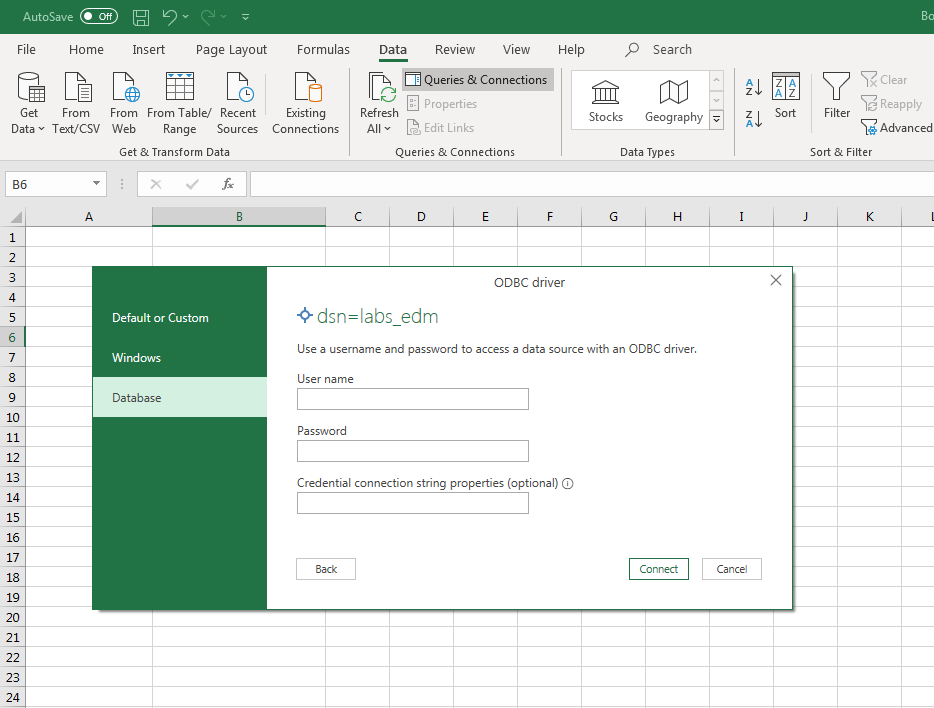
From there, a whole set of Energy Data Model tables is available for the user to access! This allows them to pick any data table they want to work with, all with a simple double click!
IoT Sensors in the Awesense Digital Energy Platform
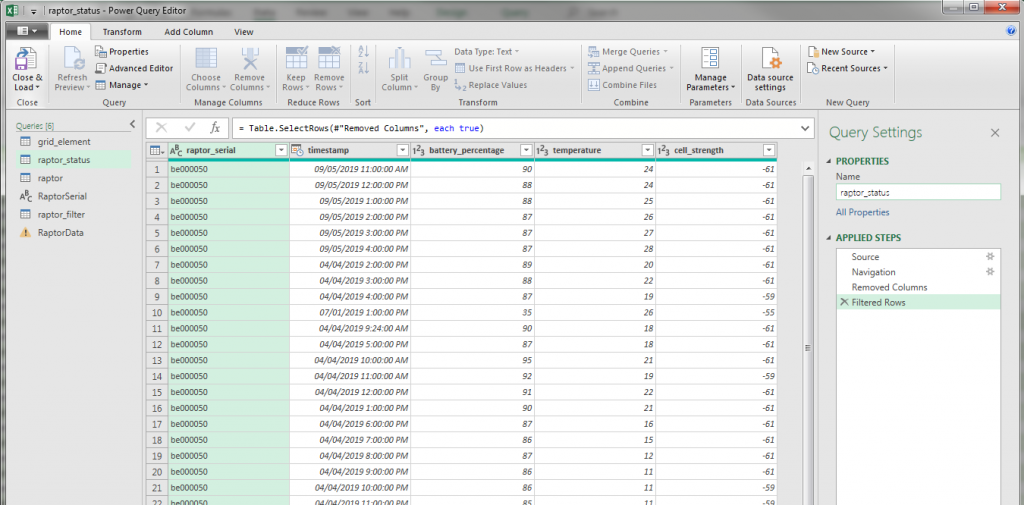
How about an example for an IoT sensor next – we’ll use our Awesense Raptor 3 in this case. Specifically, let’s look at sensor health data and analyze it further in Excel. To do this, we would pull the raptor_status data table into Excel. This operation is done easily since Excel has a built-in utility called Power Query Editor. This capability allows the user to filter, truncate and wrangle the pulled data, all without any coding skills required!
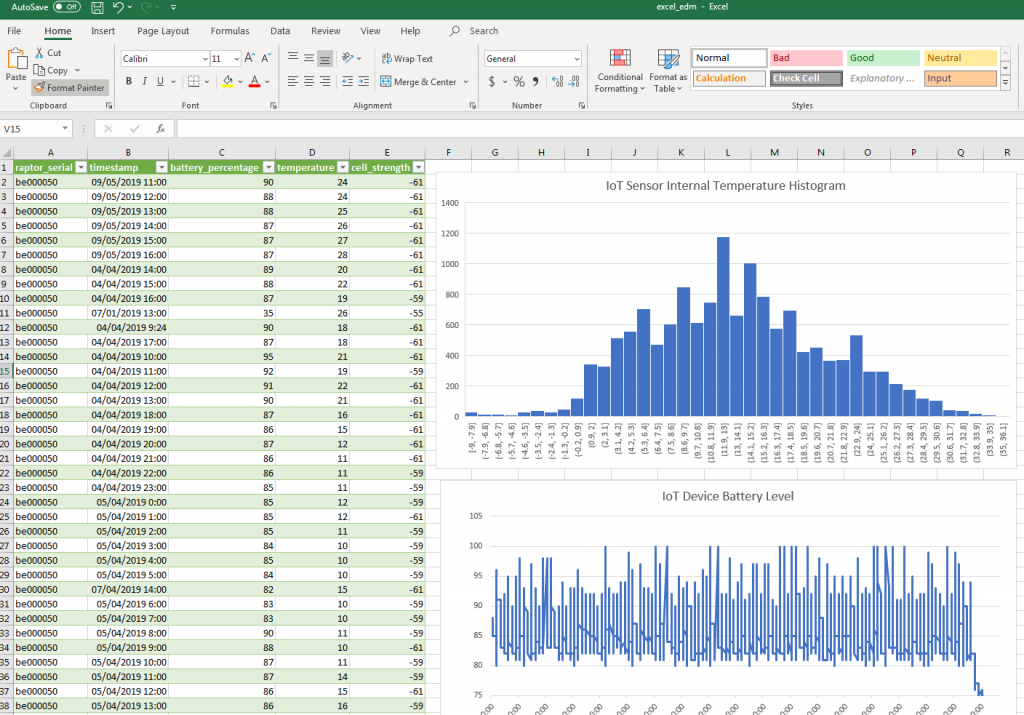
Once the user is satisfied with the data they’ve pulled, it can simply be inputted into Excel’s worksheets. This allows users to then work with the data directly in that worksheet from that point onwards. Following that same example, we can create a chart with a histogram displaying the internal temperature of our IoT sensor devices and the IoT device battery levels. It doesn’t stop there either, users can build any type of visualization and then use them as an example dashboard or a summary report.
The two examples we walked you through here are just the tip of the iceberg. These were basic operations performed with a combination of Excel and the Awesense Open Energy Data Platform. There is significantly more that you can do when you master these basics, and yes, we will cover some of these in future articles! Notable possibilities which we haven’t touched upon yet are the use of Visual Basic macro for automated CSV processing, as well as the use of advanced SQL querying in Excel’s Power Query Editor. These are a bit more advanced, but we’re sure that you can master them if you keep up with this series!
Next Up Is…
You! How are you enjoying this series so far? Please leave us some feedback by answering that question here.
We have a ton of great content lined up, with business intelligence (BI) tools as the focus of our next article. These are widely used by organizations and have become an essential component of any organization’s ongoing operations. Want a sneak peek? Answer our survey and we’ll give one lucky reader a preview!
We love connecting, and we would love for you to share our content! Follow along with this series and let us know what ideas YOU would like to see us write about. Whether it’s more content about the topics we’ve already written on or even a specific use case or tool you would like to know more about, let us know.
If you or your team are interested in building a custom application using the Awesense Platform, or you have an analytical tool we should demonstrate with our platform, feel free to reach out to us at tools@awesense.com.